Risks and Opportunities: Simple and Bow Tie Risks
The two ways to manage a risk in Clew, how to add causes, consequences and controls, and how to choose between them
Contents
- 1. Introduction & Context
- 2. Key Features & Functions
- 3. Requirements
- 4. Step-by-Step Guide
- 5. Common Issues & Troubleshooting
- 6. Related Articles
1. Introduction & Context
Clew manages risks and opportunities in two ways, simple risk and bow tie risk. Both hold the same core information. The single difference is whether your controls are mapped to specific causes and consequences, and that difference changes what the risk page can tell you.
ISO 31000, the international standard for risk management, defines risk as the effect of uncertainty on objectives. That definition is the reason Clew connects objectives to risk, risk to assurance, and assurance to business outcomes in a single thread. Start from your organisational objectives, identify the downside risks that could prevent delivery and the upside risks, or opportunities, that could help it, then link them. Even where objectives are added to Clew later, linking your key risks to them is what turns a list of risks into a picture an executive can act on.
The next step is risk appetite, the level of risk your organisation is willing to tolerate. Accepting some risk is essential: a zero-risk airline would never fly an aircraft, and a zero-risk investment company would never acquire an asset or make money. Appetite is what lets Clew highlight the risks sitting outside it, and it is controls and actions that bring them back inside. Without those, a risk is being admired rather than managed.
| Term | What it means, and why the distinction matters |
| Control | Something that, if in place and effective, reduces the likelihood of the risk event occurring, or reduces the impact if it does. Controls can be physical (a barrier), technical (a firewall), human (training) or policy and process related. Controls are enduring: they remain for as long as the risk is present, and vary over time in effectiveness. |
| Action | Raised where a control is not in place, or not effective. Actions are timebound: they apply an effect at a point in time and close by a certain date. The control "training" may weaken if capacity is insufficient or quality drops. An action to procure more training, or switch provider, closes, while the control endures, hopefully in better condition as a result. |
Most enterprise and operational risks are enduring in the same way. They remain for as long as the organisation functions and vary in level over time. Keeping the control and action distinction clean is the difference between a register that records risk and one that manages it.
A worked example. A finance team holds the risk "Non-compliance with external regulations". Its causes include undetected regulatory changes and inadequate understanding of new requirements. Its consequences include legal penalties and reputational damage. Under the simple approach, every control sits in one table and you can see at a glance which are marked not effective. Under the bow tie approach, those same controls attach to the specific cause or consequence they address, and it becomes obvious that one cause carries three controls while another carries none. Same data, different question answered.
Who is it for? Primarily risk managers, so they can use Clew in a way that supports executive engagement. Anyone who views or updates a risk sees the approach their organisation has configured.
What does it impact? The approach determines how controls relate to causes and consequences, and therefore what insight the risk page gives you. It is a configuration setting, so changing the default for a risk type affects everyone who uses it.
2. Key Features & Functions
The two approaches at a glance
| What differs | Simple risk | Bow tie risk |
| How controls are shown | One table below the risk data, a row per control. | Grouped under the cause or consequence each control addresses. |
| Causes and consequences | Recorded for information. Not linked to controls. | The parents that controls attach to. Needed before controls. |
| Question it answers well | What is the state of my controls, and who owns them? | Where am I over-reliant on one control, and where is there no protection at all? |
| Effort to maintain | Lower. Feels close to a spreadsheet register. | Higher. Every control needs a parent. |
| Typical use | Most enterprise and operational risks, and any team new to the platform. | Technical safety risks, and top risks that justify deeper analysis. |
| Visual view | Not applicable. | Yes, with click, drag and drop editing. |
Common to both approaches
The risk page shows the title in large bold type, as with every system record, and immediately above it the identified stakeholders such as risk manager and risk owner. It also shows the data from the fields available on the create and edit pages, typically the data sets you would expect in a spreadsheet risk register: review dates, risk response, risk categories and so on.
Linked risk indicators and objectives also appear at the top of the page and can be clicked through to show related data in pop-up screens. Risk ratings are shown at the top as well, covering inherent, residual and target ratings alongside overall controls effectiveness. Beyond that point, what you see depends on the approach.
Simple risks
- Controls appear in a table below the common risk data, which makes the state of controls quick to read.
- Each control is a row, an individual but linked entity, with key attributes in columns such as criticality and control effectiveness.
- Each control can be edited, with evidence and actions assigned. Actions assigned to controls are summarised in a separate action panel below the control table.
- For more advanced use, controls can be linked to other system records such as incidents and policies, and can be subject to survey responses.
- Causes and consequences can still be identified, but they are not linked to controls. The controls link to the risk, and the causes and consequences are captured for information.
Bow tie risks
- Controls are linked to specific causes and consequences.
- A control linked to a cause is a preventing control, because it helps prevent the risk event occurring. A control linked to a consequence is a mitigating control, because it mitigates the impact if the event does occur.
- On the main risk view, each cause and consequence can be expanded to show its linked controls, with the data associated with each control including evidence and actions.
- The risk can also be shown in a bow tie visual view: causes and preventing controls to the left of the risk, mitigating controls and consequences to the right, adjustable with a click, drag and drop interface.
What sub-panels can link to the risk standard view?
The standard view is the risk page itself, as opposed to the bow tie visual view. What appears depends on your organisation's configuration, but the following can link to it:
| Sub-panel or link | What it gives you |
| Controls | A table of linked controls in the simple approach, or controls grouped under each cause and consequence in the bow tie approach. |
| Causes and consequences | Captured for information in the simple approach, and used as the parents for controls in the bow tie approach. |
| Actions | A summary panel of the actions assigned to the risk's controls, so you can see outstanding work in one place. |
| Risk indicators | Shown at the top of the page and clickable through to related data in a pop-up. |
| Objectives | Linked business objectives, shown at the top of the page and clickable through in the same way. |
| Risk ratings | Inherent, residual and target ratings, with overall controls effectiveness. |
| Attachments and evidence | Held against a control, so the assurance behind a rating sits next to the rating. |
| Commitments and obligations | Added against a control, linking the risk picture to your compliance picture. |
| Resources | Added against a control, recording what the control depends on. |
| Surveys | Controls can be subject to survey responses, for example an inspection that tests whether the control is working. |
| Other system records | For advanced use cases, controls can be linked to records such as incidents and policies. |
Choosing between the two
The point of having both is that the system adjusts to your context rather than the other way round.
- Use simple risk where mapping controls to causes and consequences is not needed. That mapping can be too much too early and create resistance to use, particularly for teams moving off spreadsheets. Simple risk still gains you accountability, evidence and insight into control management, through a tabular presentation that feels familiar. It also ensures consistency through the control library, and lets you compare control performance across the organisation.
- Use bow tie risk for risk types such as technical safety risks, and for top risks that justify deeper analysis. It exposes how dependent you are on specific controls in a given cause or consequence line, and makes it visually obvious where protection is thin.
- A practical route is to start a risk type on simple, then move your top risks to bow tie once the team is comfortable and the control data is trustworthy. Bow tie analysis built on unreliable control data produces a convincing picture of the wrong thing.
3. Requirements
When your system is configured, Clew needs to know which approach you want. These are system settings, and the options are:
- Simple risks throughout.
- Bow tie risks throughout.
- One risk type defaulting to simple and another defaulting to bow tie.
- The toggle option, so users can switch between the two themselves.
To find out which applies to you, open a risk and look for the slider at the top of the page. If it lets you change view, the toggle option is enabled. You also need permission to add and edit controls, causes and consequences on the register the risk sits in.
4. Step-by-Step Guide
Adding controls to a simple risk
- Create the risk.
- In the Controls panel, select Add.
- To see more detail on an existing control, such as its linked actions, expand its row in the table.
- Use the row options to add records to a control, for example a new action or attachment, or to edit the control itself.
What you should see: each control as a row carrying its criticality, owner, type, control effectiveness and whether it is implemented, with counts of critical and non critical controls at the top of the panel.
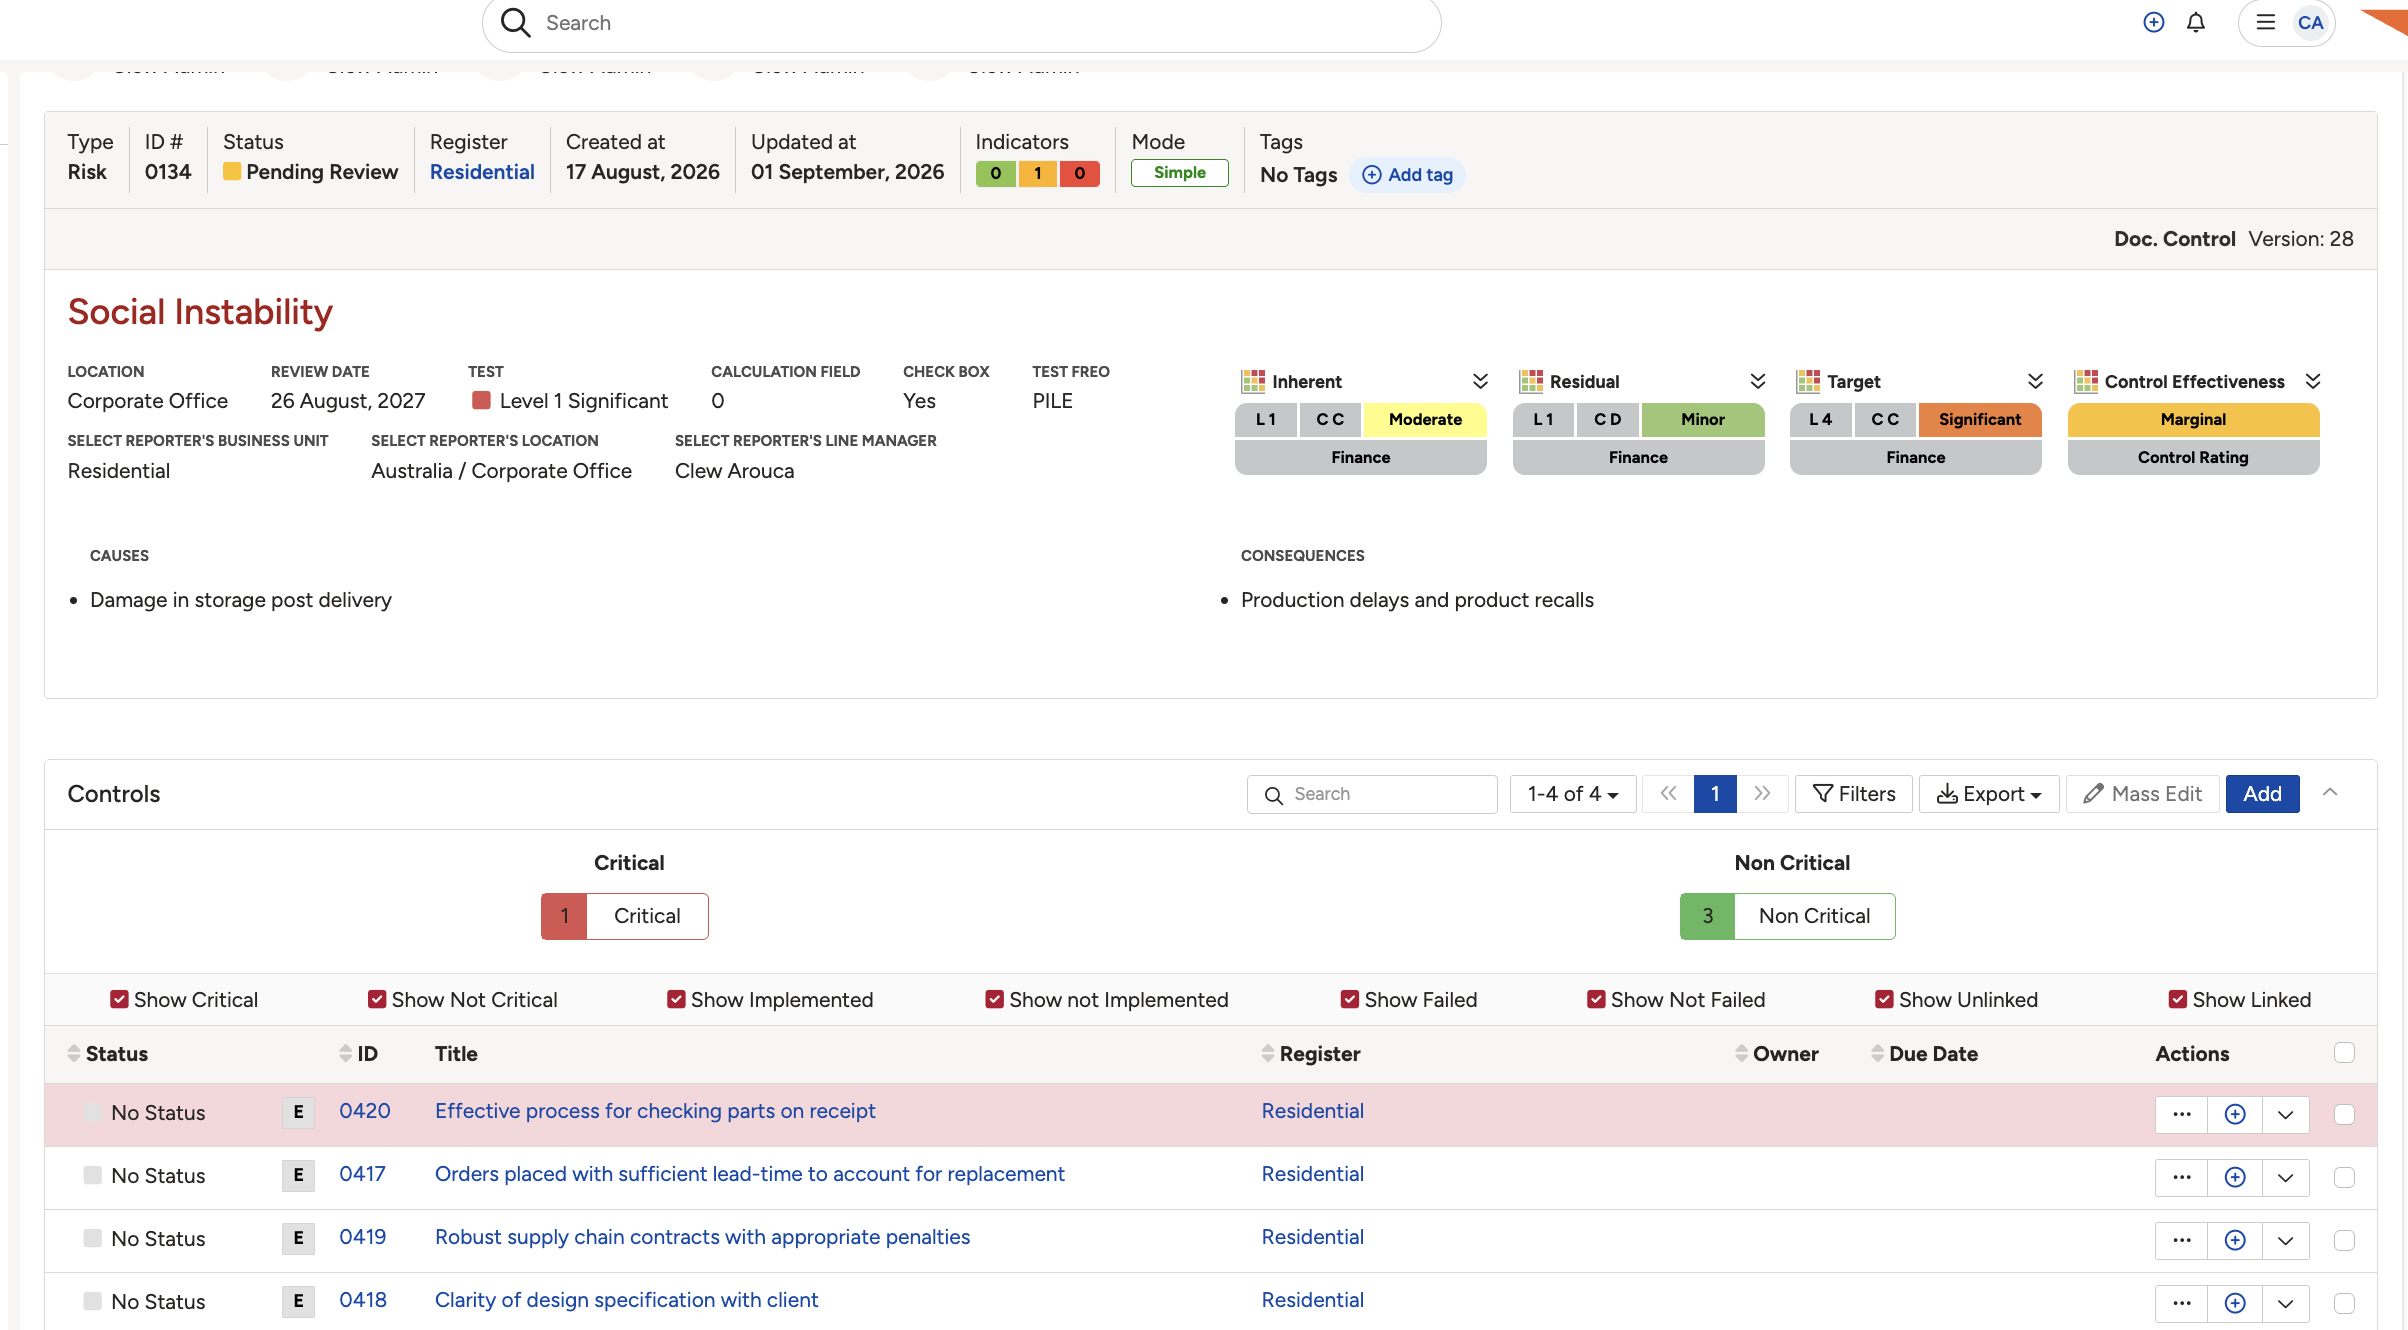
The simple approach: all controls in one table below the risk data.
Adding causes and consequences to a bow tie risk
- Create the risk. Add causes and consequences before controls, because controls attach to them.
- On the main risk page, use the Add button at the top of the Causes and Consequences areas.
- Alternatively, open the bow tie view through Views, then Bowtie, at the top of the page. Hover below the Causes or Consequences titles and select the + option.
Adding controls to a cause or consequence
- On the main risk page, select the + icon against the specific cause or consequence.
- Or in the bow tie view, hover in the No controls found box and select the + option.
- Repeat until every cause and consequence that should be protected carries at least one control.
What you should see: each cause showing its preventing controls and each consequence showing its mitigating controls, with an implemented count against each, so a line with no protection stands out immediately.
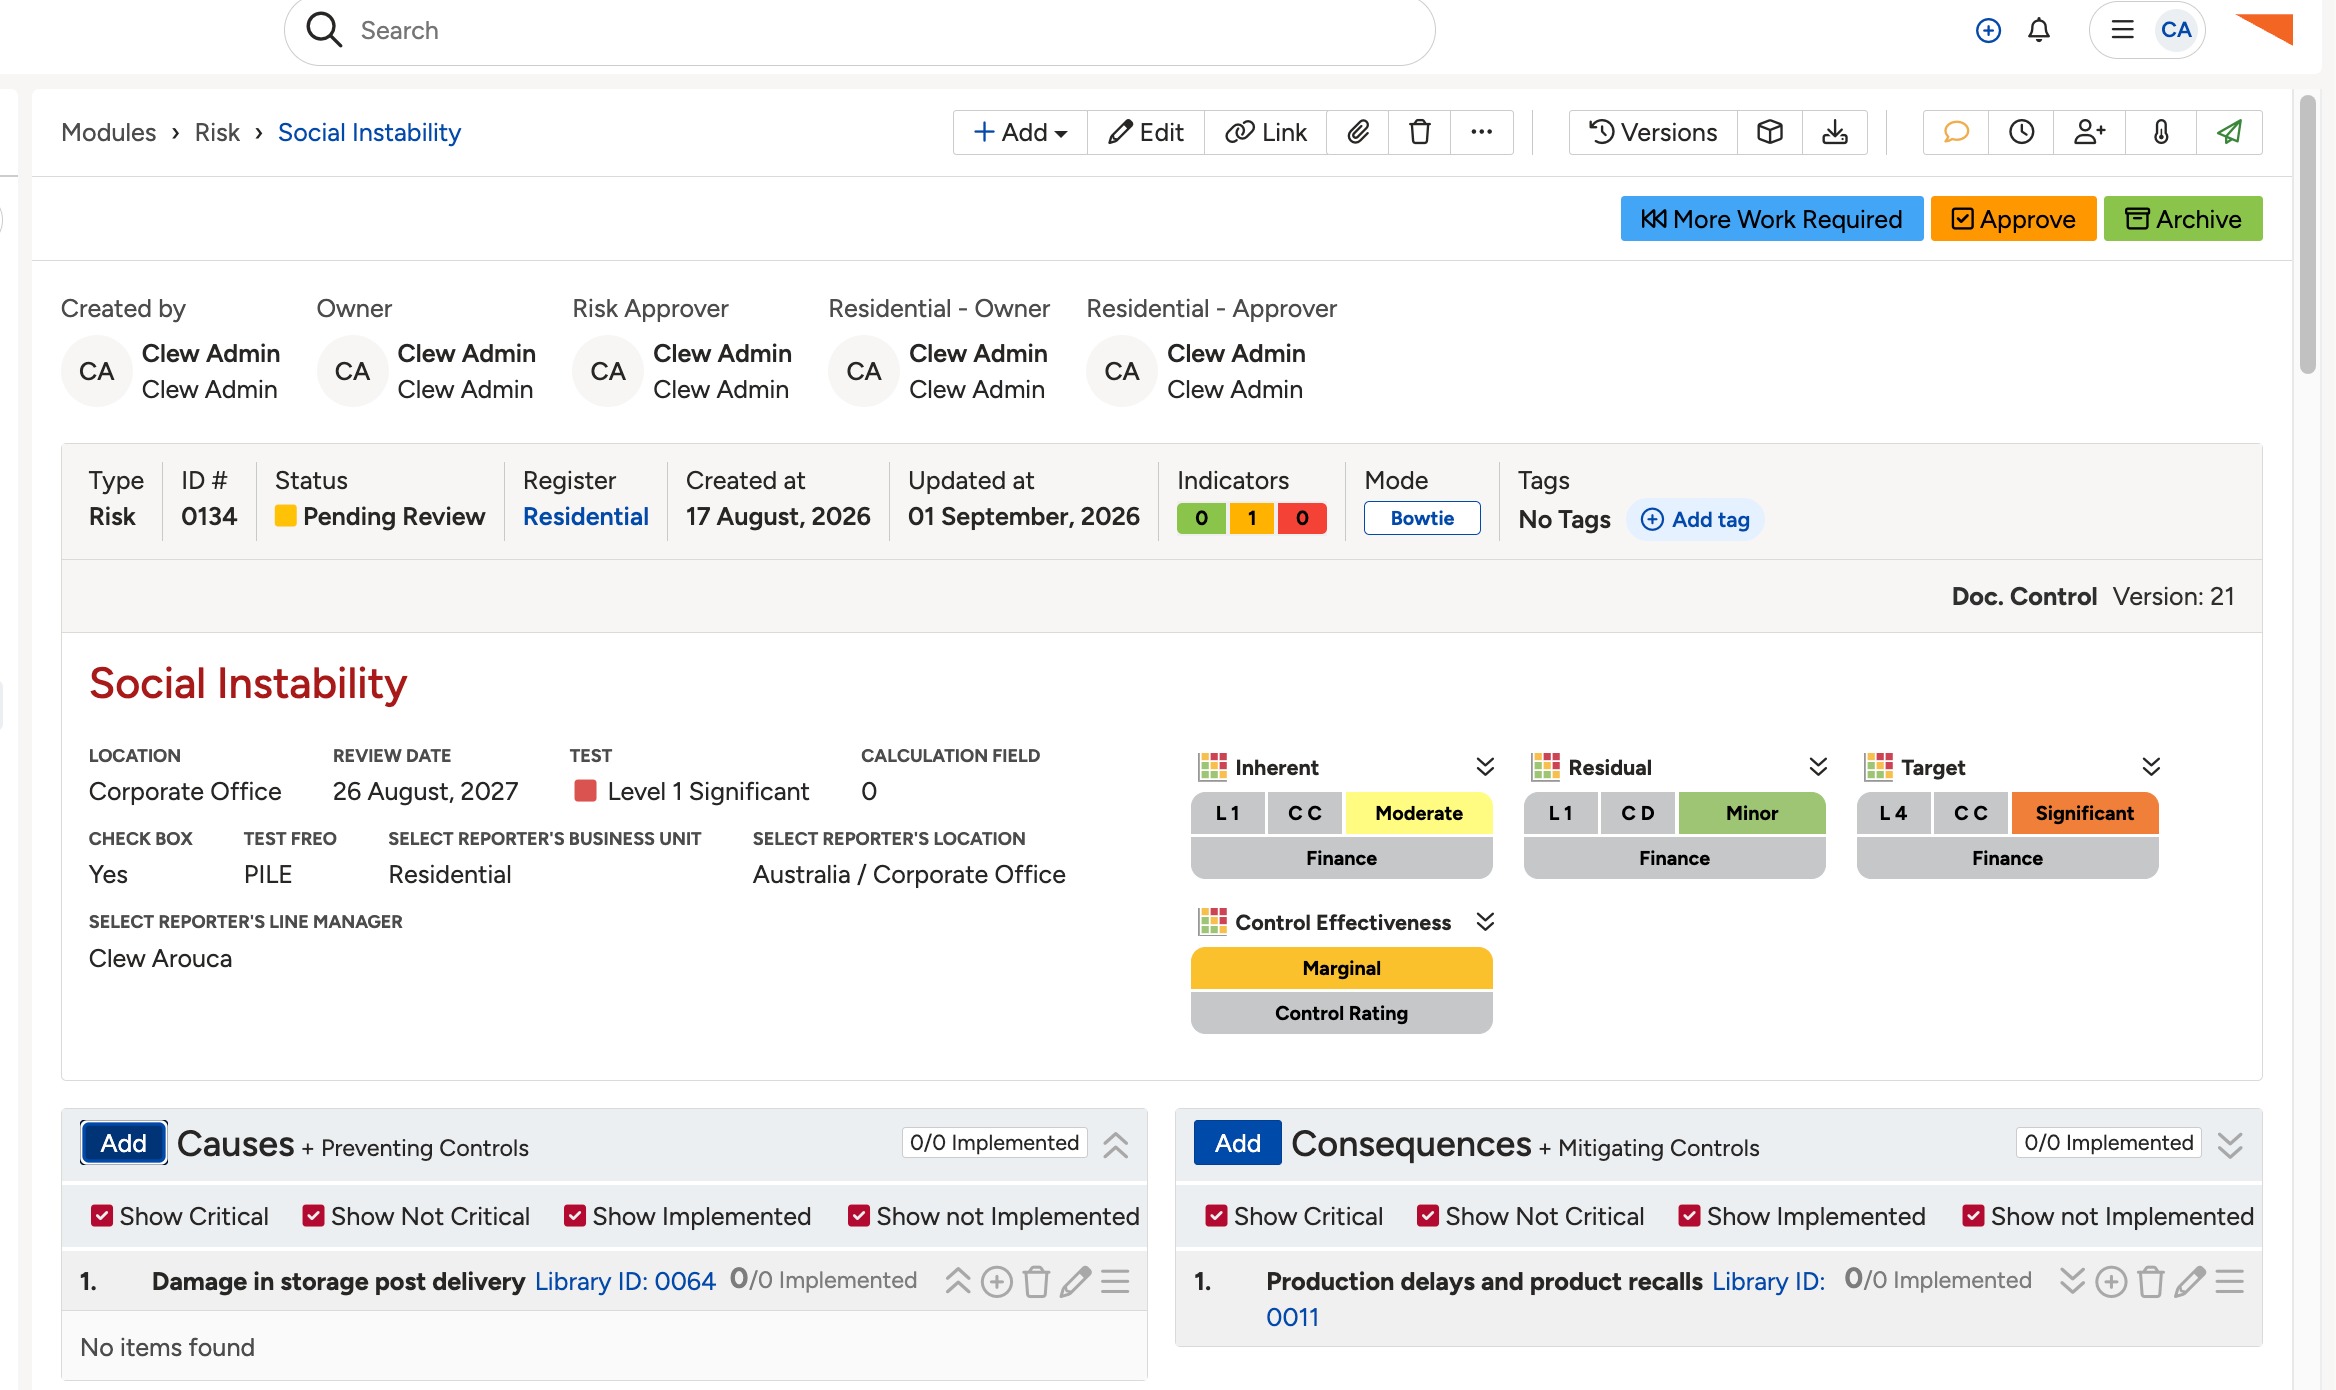
The bow tie approach on the risk page: controls grouped under causes and consequences.
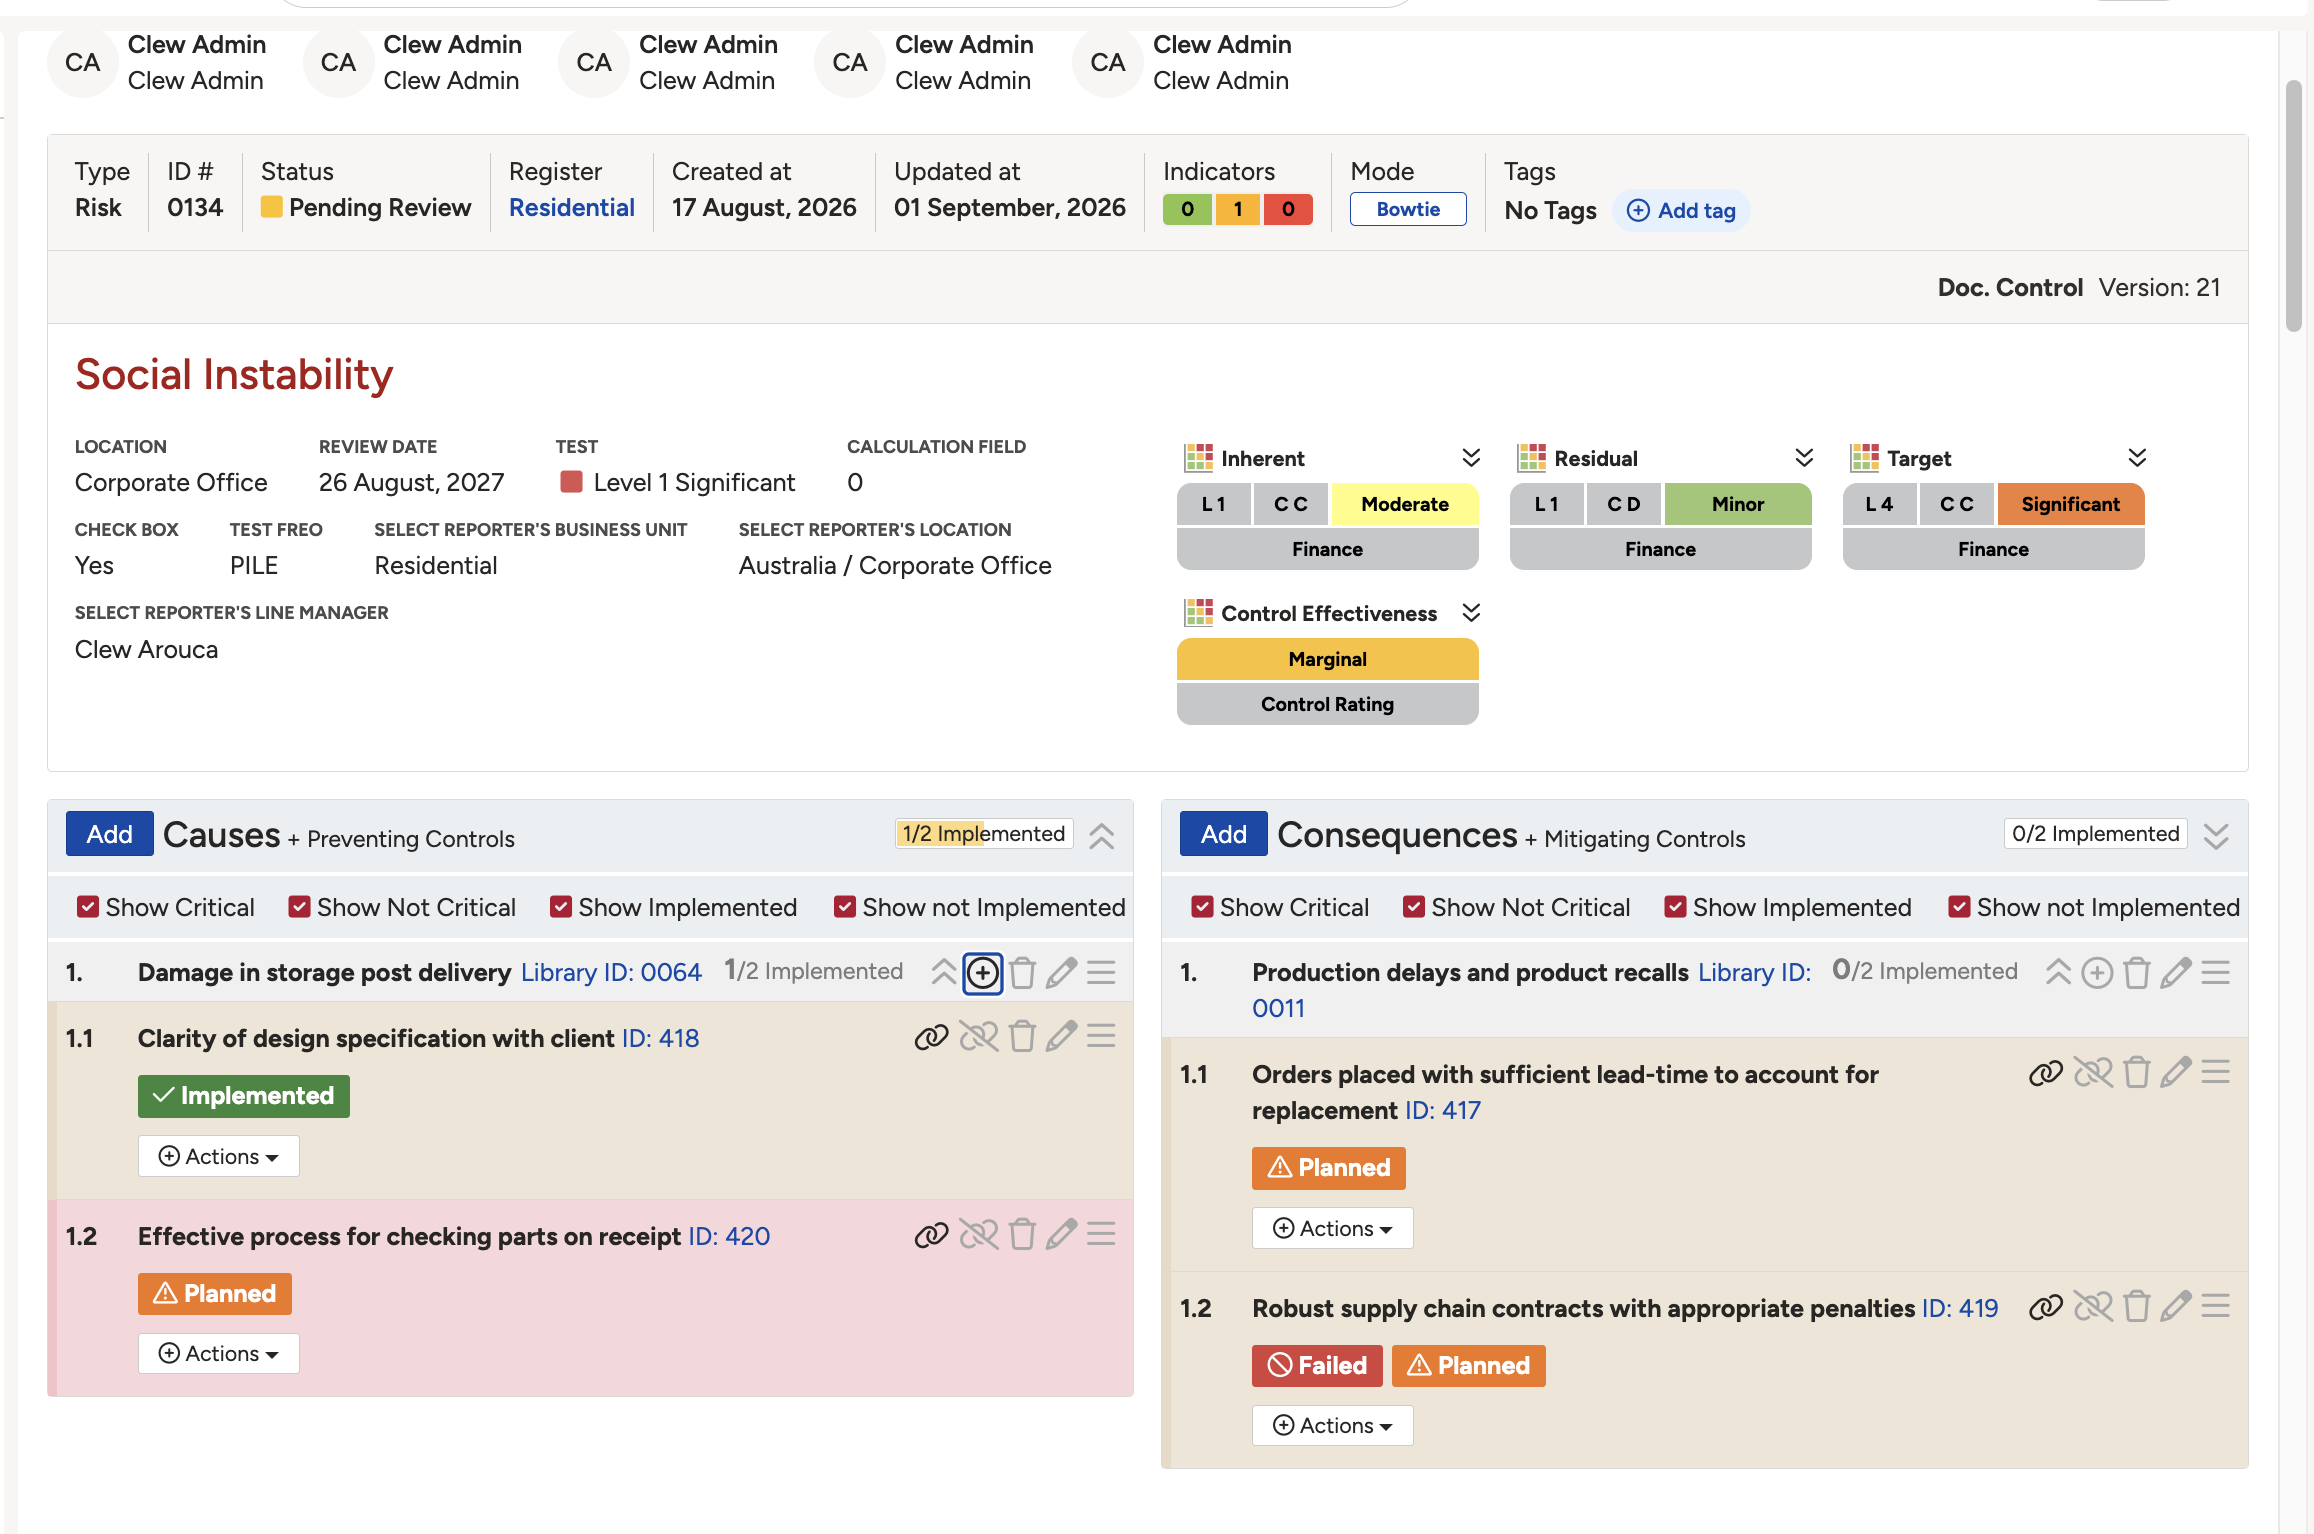
Expanding a control shows its data and everything that can be attached to it.
Working in the bow tie visual view
- Open Views, then Bowtie, at the top of the risk page.
- Read it left to right: causes, preventing controls, the risk with its ratings, mitigating controls, consequences.
- Add a control by hovering where one is missing and selecting +, and reorder controls by click, drag and drop.
- Use Standard view to return to the risk page.

The bow tie visual view, read left to right.
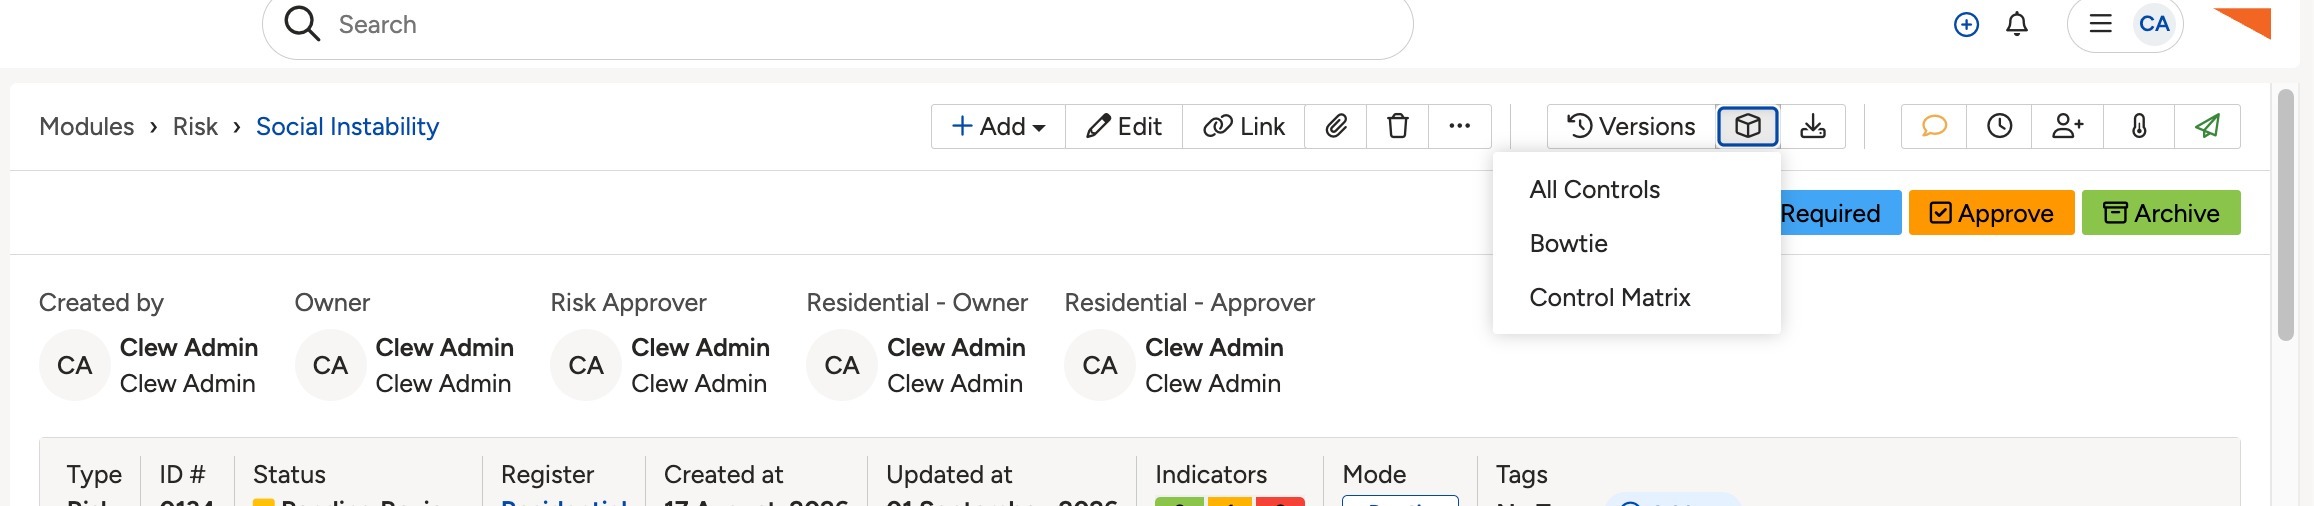
Each control card carries its effectiveness, implementation status and action count.
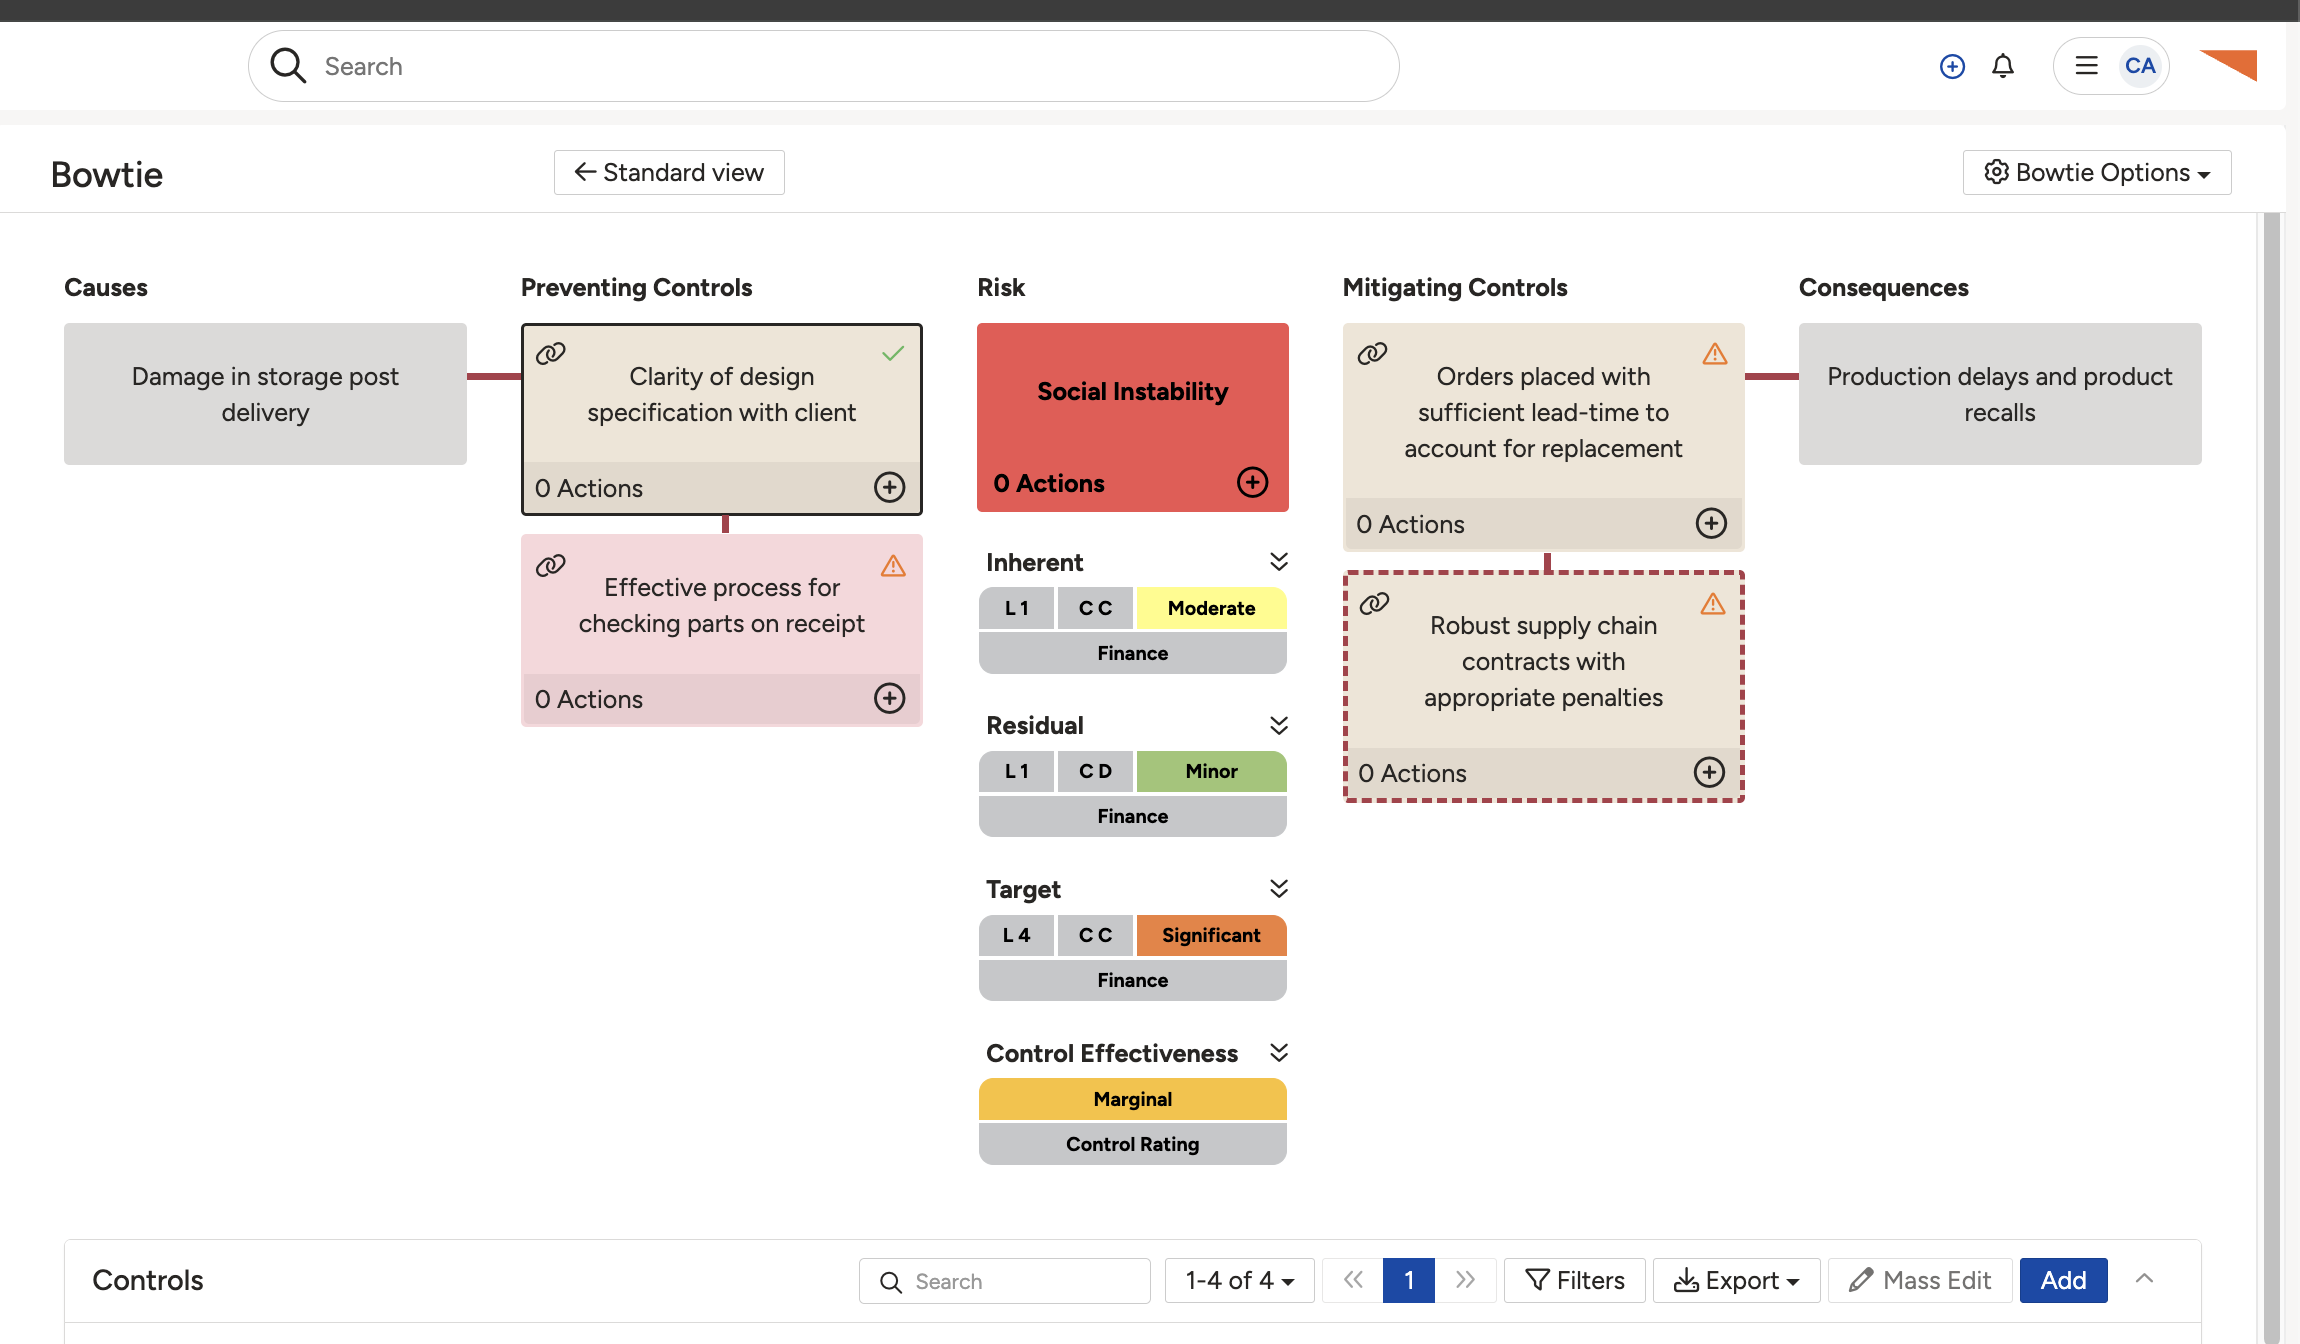
Hover where a control is missing and select the plus option to add one.
Toggling between simple and bow tie
Where the toggle is enabled, use the slider at the top of the screen to switch approach.
- Bow tie to simple: the risk collapses into the simple view and controls appear in a table. They are no longer mapped to causes and consequences.
- Simple to bow tie: the risk flips to the bow tie view, but the controls then need tagging to parent causes and consequences. See the troubleshooting section below.
5. Common Issues & Troubleshooting
| Issue | Likely Cause | Solution |
| Controls are not attached to anything after switching from simple to bow tie | This is the main thing to watch when toggling. Controls from the simple table have no parent cause or consequence | Use the link option under the ... menu on the control. Clew then presents the causes and consequences for selection. |
| The bow tie view shows No controls found under a cause | No control has been linked to that cause yet | Hover in the No controls found box and select the + option to add one, or link an existing control to that cause. |
| There is no slider to change the view | Your system is configured to a fixed approach for that risk type, rather than the toggle option | Raise a request with Clew if the approach for that risk type needs changing. It is a system setting. |
| Causes and consequences are recorded but the controls ignore them | The risk is using the simple approach, where causes and consequences are captured for information only | This is expected. Switch that risk to the bow tie approach if you need controls mapped to specific causes and consequences. |
| Editing a control changed it on other risks too | It is a library control, shared across the organisation, rather than one local to this record | Check whether a control comes from the library before editing it. Create a copy if the change should apply only to this risk. |
| The residual rating looks wrong given how many controls are in place | Control count does not drive the rating. Effectiveness and criticality do, and a control marked not effective contributes nothing | Review the control effectiveness values and overall controls effectiveness, then raise actions against the controls that are failing. |
Best practices:
- Start from objectives, then identify the risks to them, then set appetite. Controls and actions come after that, not before.
- Link key risks to objectives even if the objectives are added later. That link is what makes the risk picture useful to an executive.
- Keep the control and action distinction clean. Enduring things are controls, timebound things are actions.
- Reserve the bow tie approach for risks that justify the analysis. Applying it everywhere can create resistance to use.
- Add causes and consequences before controls on a bow tie risk, so every control has a parent from the start.
- Attach evidence to the control it supports, not to the risk. It is the control rating that gets challenged, so that is where the proof needs to sit.
Click the title to preview it here. Use the Open full article button to read the full version in a new tab.
▾Risk Toggling: How To (If Enabled) Open full article »
Related article
The step-by-step walkthrough for switching an individual risk between the simple and bow tie approaches, and what happens to your controls on the way through.
Was this article helpful?
That’s Great!
Thank you for your feedback
Sorry! We couldn't be helpful
Thank you for your feedback
Feedback sent
We appreciate your effort and will try to fix the article